Update: Version 1.4 (All early versions are redundant):FatStats AutoZerrett 2017 Predictions V1.4
Its Brownlow time of year again, and the newly re-badged AutoZerrett Brownlow tipping algorithm we published last year is back and it is new and improved (hopefully!). To save going through the basics of how it works again, there is a fair bit of detail in the post here. AutoZerrett is powered by a machine learning algorithm called a Random Forest, which uses player’s statistics for each game to give them a probability from 0-100% of getting 3 Brownlow votes from the umpires. The three top highest probabilities for each games are awarded the synthetic votes. 6 years of data is used to train the algorithm and only 3 vote games are used as the target variable (1 and 2 vote games are discarded due to the mixed statistical signal that can give them i.e. umpires often give two votes to the best player on the ground from the losing team). There are pros and cons to the discarding of 1 and 2 vote games, but our testing showed that the predictions worked better without them (although Tom Mitchell or “Two Vote Tom” as we call him, may prove us wrong this year).
Lord Zerrett and his blind assistant ponders another top 10 finish under age 22
AutoZerrett performed reasonably well last year, but there was several areas we wanted to improve on. The main one was the lack of ability to recognise a 3 vote game from the games more enigmatic players, that is, Cyril Rioli, Buddy Franklin, ruckmen and Alex Rance. There are two main reasons behind this: 1. The readily available statistics do not capture everything, in particular relation to things like pressure acts, spoils, high skill efforts, eye catching marks and other non-tangible events that makes AFL what it is. The second point, arguably the more important, is that there just isn’t that many of them – the bulk majority of 3 vote games (~60%) go to midfielders, and in the previous 6 years those votes have been distributed to inside midfielders more often than not.
| Position | Actual | Actual (%) | After SMOTE | After Smote (%) |
| Defender | 88 | 7% | 356 | 12% |
| Forward | 254 | 19% | 653 | 23% |
| General | 157 | 12% | 426 | 15% |
| Inside Mid | 518 | 38% | 611 | 21% |
| Outside Mid | 267 | 20% | 312 | 11% |
| Ruck | 68 | 5% | 508 | 18% |
| Total | 1352 | 100% | 2866 | 100% |
What this means practically in machine learning is that we have class imbalance, or rare events, which we are trying to model. The first and obvious one is that we are trying to predict the 3 vote game, which for a particular game is only awarded to one out of 44 players playing (2.2%). The second is that even though a ruckman or a low possession forward with 15 pressure acts is not the “normal” way to get three votes, it doesn’t mean the umpires aren’t going to reward it. We dealt with the first issue last year using an cross-fold sampling scheme that used a different random sample of non 3-vote scoring games each iteration. Essentially we just changed the background data to cover a number of different statistical scenarios. This year we attempted to go one step further and improve the accuracy by creating artificial 3 vote games for low likelihood classes, essentially defenders, forwards and ruckmen, using a process called SMOTE. As the above table shows we created approximately 1500 data points using the existing statistical signatures to try and level the playing field for minority positions. To get an idea of whether this worked, we re-run last year the traditional way and the new way and investigate the error.
| Position | Average Votes error per player (traditional) | Average Votes error per player (SMOTE) | Change in model (votes) | Change in accuracy due to SMOTE | Actual Vote Percentage |
| Defender | -1.28 | -1.07 | 0.21 | 16% | 9% |
| Forward | -1.38 | -0.83 | 0.55 | 40% | 24% |
| General | -0.57 | -0.54 | 0.02 | 4% | 3% |
| Inside Midfield | 1.67 | 0.90 | -0.77 | 46% | 49% |
| Outside Midfield | 0.29 | -0.13 | -0.41 | 56% | 10% |
| Ruck | -3.10 | -1.69 | 1.41 | 46% | 4% |
SMOTE worked quite remarkably well, improving error for every single position. The above table shows from left to right for each position type the average error per player using the traditional methods and the new SMOTE method. As you can see, last year’s model was overestimating inside midfielders by 1.67 votes per person, and under estimating rucks by 3 votes. The SMOTE predictions improved for all of the positions, albeit only a small improvement for the bucket group of “general” (not just Jon Patton). There is still work to be done on defenders, but as the last column shows they only make up 9% of the final votes so it doesn’t make too much difference unless you’re a Ranceophile.
One big difference in the way the results look this year is that last year we released one iteration of the model – the one we deemed the best looking (not very scientific really, but it worked). This year we are releasing the full spread of 100 models. There is likely models in the data that are more conservative, and ones that over-estimate, but the hope is that the averaged response gives a good indication of likelihood. Dustin Martin’s modelled votes are included here to show the variation between models:
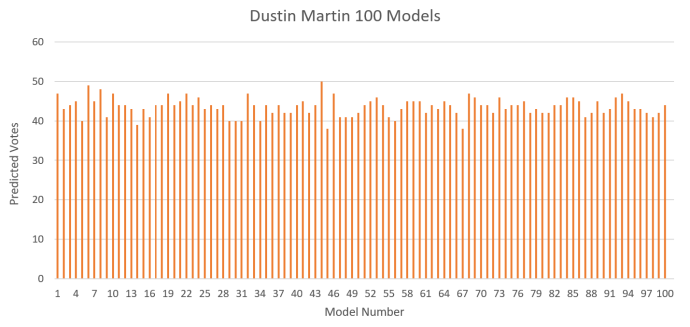
As you can see, Dustin is project to get on average 43 odd votes – which is huge – but there are some models where he gets below 40 and even one where he gets 50 (massive outlier). Our gut feel is that these numbers are over estimating, and a conservative approach should be taken however we will wait and see.
Dustin questions the 3 models which had him under 40 votes.
RESULTS
This year, we have put an emphasis on generating usable outputs and visualisations. Our 2017 Brownlow report breaks down predictions into round by round, team by team and overall ranking which should be a bit easier to use than the table format last year.
So without further ado, winner and the remaining 49 of the top 50 predicted vote getters for 2017 is…
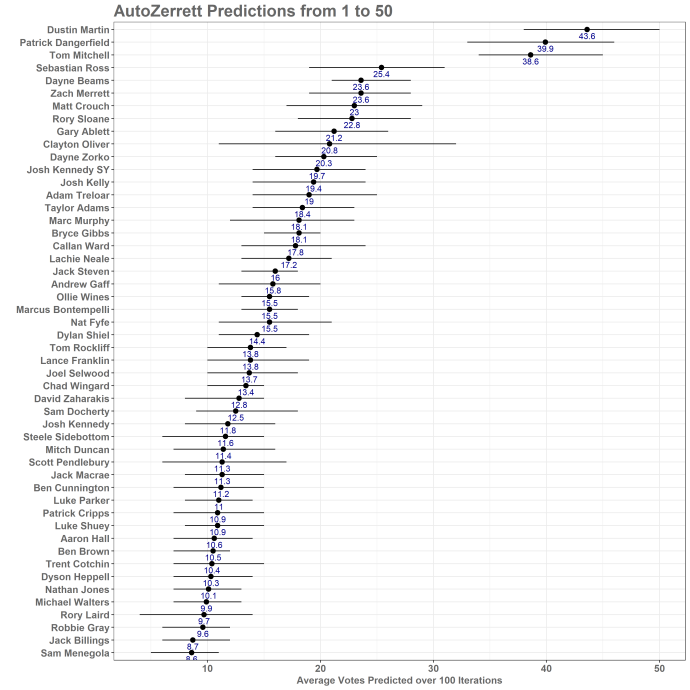
We will comment more on the predictions throughout the week, but a couple of key points that jump straight out:
- Dustin Martin has had a HUGE YEAR. Its unlikely he will get 43 votes, but he is every chance to break the record set by Dangerfield last year. Round by round, he was rarely not in the mix and no-one else at Richmond is a vote stealer (this applies to, you Joel Selwood).
- The model also predicts massive numbers for Patrick Dangerfield and Tom Mitchell. Personally, I can see ways for both of those two to be mathematically over-inflated – Dangerfield has a large amount of 3 point games in the training data – the model loves a “Danger” style game and like the umpires in the Sydney match, is probably susceptible to bias. Tom Mitchell may be the prime example of a player who even when he was the best player on the ground statistically, is only going to get 2 votes due to being on the losing team (hence, two-vote Tom). He also isn’t very impressive to anyone but other inside midfielders. It will be interesting to see how that plays out but its worth keeping in mind.
- The numbers seem high overall.. Three players are predicted to score over the Brownlow record set last year. It seems unlikely that the magnitudes predicted here are going to be achieved, but the overall trends seem solid. Further investigation neeeded.
- Josh Kelly is further down the rankings than expected. We have watched a lot of Essendons next great recruit this year and he is a Gun (Editors note: We just saw that he signed with GWS and we would like to clarify that he is not that great and AZ is being generous with 19 votes). There could be several reasons for him to be predicted lower on the rankings than what most pundits have (19 votes is not low overall however). The main statistical reason is that there hasn’t been a lot of players like him winning votes for a while, the last one was probably Chris Judd. In the six years used as training data, Brownlow votes have tended to go to midfield bulls of the Danger, Fyfe, Priddis and Watson types, not necessarily the silky Rolls Royces. On the flip side, its a common occurrence in Brownlow vote allocation for players to have to “pay their dues”, and their performance is often not recognised by the umpires until the year after.
- The model has absolutely no idea how to judge Clayton Oliver. He has by far the biggest range of any player. We will investigate this during the week and maybe put out a little post on why that might be.
Again, the results are included in a downloadable PDF in full here:FatStats AutoZerrett 2017 Predictions V1.4 Please hit us up with any questions or observations (especially if we have stuffed anything up). We are definitely interested if people use this data to have a punt, however as usual remember that its at your own risk and FatStats takes no responsibility. That being said, we will be going through the data ourselves for punting purposes and we plan on releasing bits and pieces during the week so follow along if you’re interested. Enjoy!!
Clayton is as unpredictable on twitter as he is for the brownlow medal.
Notes: All data is sourced from http://www.afltables.com.au. All images are from wikimedia.creative commons and Clayton’s tweet is Clayton’s tweet. All processing was carried out using R Studio which is open source and great.

Great work, interested to see how it improves this year. Where is the PDF accessible?
LikeLike
Hi Mark, sorry you must have looked at it just as I uploaded version 1.1 with the Melbournes round by round included this time. Should be fine now!
LikeLike
Cheers, got it.
LikeLike